Ever wondered about the 7 Pillars of Power BI!

In the previous blog we did the introduction to Power BI and discussed architecture design behind Power BI. In this article we are going to discuss about some of the most important things which are required to start your Power BI journey effectively.

There are 7 steps that you have to remember while working with Power BI. I will call this 7 steps to follow as “The 7 Pillars of Power BI”.

So here is the diagram representing the 7 Pillars of Power BI.

The 7 pillars are as follows:

  1. Extract
  2. Transform
  3. Modeling
  4. Calculations
  5. Visual
  6. Distribution
  7. Automation

Let’s discuss each of them now

Extract: This is the step where we get the information from the data set performed in Power BI Desktop. You can talk to any data source with ha highly simplified Power BI interface. Power BI can connect to any data source to bring meaningful insights to the end-user. It is simple to import any custom file into Power BI. Connecting data from multiple data sources can be achieved by anyone new to Power BI.

Transform: It is the second pillar where we can clean and treat the data. This is performed in Power Query Editor which is the part of Power BI Desktop Environment. After Data Loading, it should undergo pre-processing according to the requirements. This process is called Data shaping or Data Transformation. It involved various steps like renaming tables and columns, changing the data type, modifying rows and columns, appending, merging, etc.

Modeling: Third Pillar where we can create relationships between the data tables and is done using Power BI Desktop. Here we enhance the data to get more accurate insights and analytics. This is achieved by creating relationships and hierarchies between various data tables for better analysis.

Calculations: This is the Fourth Pillar where we can create various measures using DAX language analysis. DAX is also known as “Data Analysis Expressions”. It is achieved by creating several measures and calculated columns. Even M Language is used for various purposes, especially for Data and Time operations.

Visuals: This is the Fifth Pillar where we can create the storytelling and present the information and insights through various visualizations using Power BI. Visualizations is the heart of Power BI. We can play with a variety of visualizations, right from in-built visualizations to custom visualizations. Power BI is the Pechora of visual tools and custom visuals. Business users acquire good analytical insights without writing a single line of code.

Distributions: This is the Sixth Pillar where we share the reports created to end-users, stakeholders, and customers through Power BI cloud platforms. To achieve this distribution Power BI service where you can make changes in the report and share reports with anyone.

Automation: This is the Seventh Pillar where we update the dataset automatically, this is being performed on Power BI cloud platforms. Automating the data and further refreshing the data takes place in this automation process of Power BI, this is achieved using Power BI Service.

So here are the most important 7 pillars or 7 steps you have to keep in mind while performing any Power BI project.

From the next blog, we will start the Power BI Installation and Setup followed by the main concepts of Power BI.

Happy Learning!! 🙌🙌🚀

All About Power BI Architecture Design

In the previous article we had a detailed introduction to what actually Power BI is and how it is used. In this section we are going to discuss a new topic and an important one to kick-start the Power BI journey. Here, we will discuss Power BI Architecture, its components and the Power BI Service architecture. So let’s start.

Power BI Architecture

Power BI architecture consist of 4 major sections that starts right from Data Sourcing to the creation of reports and dashboards. If we observe various technologies and processes are working together to get the desired outcome with correct accuracy. This is the reason Power BI is among the market leader when it is about Reporting and Dash boarding tools.

Power BI Architecture

Sourcing of Data: Power BI can extract data from various data connectors. It can be servers, Excel Sheets, CSV files, other databases and many more. You can even extract live data or a streaming data in Power BI. The extracted data is directly imported in Power BI within few seconds and is compressed up to 1 GB. After sourcing of data you can perform Data Transformation operations.

Transforming the data: As we know the Golden Rule of Data Analytics that before analyzing or visualizing the data we have to clean the data to get the accurate insights. So in this step Data Cleaning and Pre-processing takes place. After transforming data, the data is loaded into data warehouse and further analysis takes place.

Creating Reports or Visualizations: After data transformation process, different data reports and data visualizations are made based on the business requirements. A particular report has various visualizations of the data with different filters, graphs, charts, diagrams, etc.

Creating Dashboards: Planning and arranging all elements of Power BI report makes a Power BI Dashboard. Dashboards are created after publishing the reports in Power BI service.

Components of Power BI Architecture

Various components included in Power BI Architecture are as follows:

1) Power Query: This component provided by Power BI is used to access, search and transform data from various data sources.
2) Power Pivot: It provides tools to model data from internal memory data source for analytics.
3) Power View: These components have various tools to represent data through various visuals which are used for visual analysis.
4) Power Map: It has abilities to represent spatial data in form of maps. The important advantage of Power BI is that we can use maps in different customized ways.
5) Power BI Desktop: Power BI Desktop is the heart of entire Power BI platform. Its development tool for Power View, Power Query, and Power Pivot. You can import various data sources and perform visualization tasks.
6) Power Q&A: Using the Power Q&A option, you can search for your data and find insights by entering queries in natural language format. It can understand your questions asked and answers it with relevant insights in form of various visualizations.
7) Power BI Service: The Power BI Service helps in sharing the workbooks and data views with other users. Even data re-freshing can take place after regular intervals.
8) Power BI Mobile Apps: Business stakeholders can view and interact with the reports and dashboards published on a cloud service through mobile using Power BI Mobile Apps.

Working of Power BI Architecture

The Power BI architecture is mainly divided into two parts:

  1. On-cloud
  2. On-premises

The below diagram is also called as Power BI Data Flow diagram that may help you to clearly understand the flow of data from On-premises to On-cloud server applications.

Power BI Gateway Diagram

On-premises

All the reports published in Power BI Report Server are distributed to the end users only. Power Publisher enables to publish Power BI reports to Power BI Report Server. Report Server and Publisher tools by Power BI helps to create datasets, paginated reports, etc.

On-cloud

In this Data flow diagram, Power BI gateway acts as a bridge in transferring data from on-premises data sources to on-cloud servers. The clouds consist of various stuffs such as datasets, reports, dashboards, embedded, etc.

Power BI Service Architecture

It is mainly based on two clusters they are mainly:

  1. The Front-end Cluster
  2. The Back-end Cluster

The Front-end Cluster

The front-end cluster behaves as a medium between the clients and the on-cloud servers. After the initial connection and authentication the client can interact with various datasets available.

The Back-end Cluster

The back-end cluster manages datasets, visualizations, data connections, reports, and other services in Power BI. These Components are mainly responsible for authorizing, routing, authentication and load balancing.

Here, we have completed the architecture part behind the Power BI and in the next article we will study about some of the “7 Important Rules” that we need to remember to become pro in Power BI.

I hope you liked and understood the write-up. Meet you all soon in the next blog. Stay tuned and Happy Learning !! 🚀🚀👋

Getting an overview of Power BI

Introduction

Hello guys, here we are with the super series of Power BI articles and the following blog is the first part of the series. The complete series will be divided into various sub-parts where we will discuss the important features and other tutorials related to Power BI.

The blogs are going to be in quite detailed manner which will be enough for you guys to learn Power BI and become a pro in it.

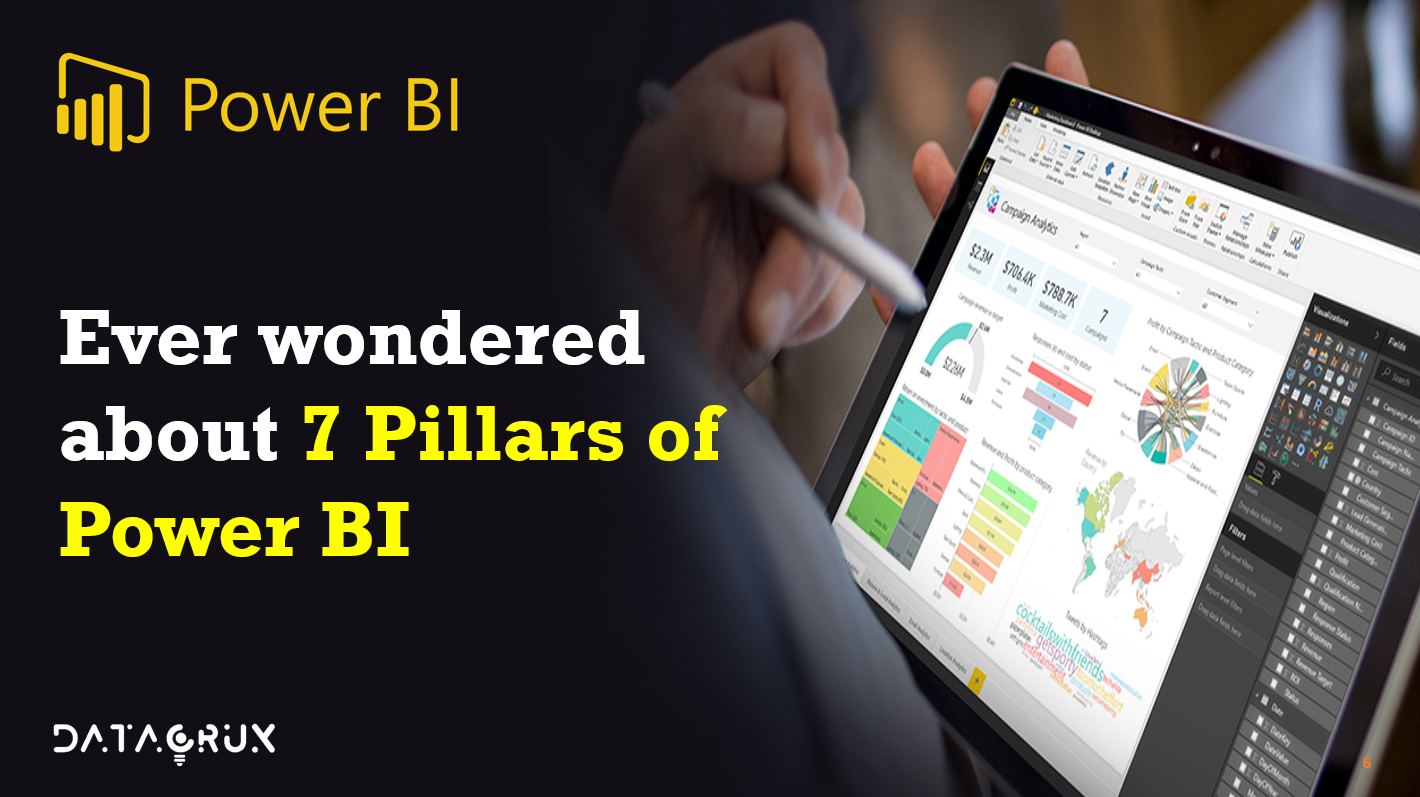
All right the time has come for us to officially meet Power BI by a quick summary. Here Power BI is a standalone Microsoft business intelligence product which includes both desktop and web based applications for loading modeling and visualizing data.

There’s a ton of additional info if you’d like to learn more at powerbi.microsoft.com

Now I want to show you something called the Gartner Magic Quadrant and Gartner’s and market intelligence
research company. They produce these quadrants a few times a year. And what we’re looking at here is the Magic Quadrant for analytics and business intelligence platforms specifically updated February 2021 and the idea is that you have completeness of vision on the x axis and the ability to execute on the Y axis.

And when you break down the players into the four quadrants you end up with niche players challengers, leaders and visionaries and where you want to be is right here in this top right corner where the leaders live.

And that’s exactly where we find Microsoft with power BI leading the charge among some very popular and very powerful other platforms like Tableau, IBM, Qlik, etc.

So really exciting time to be learning power BI because I think it’s only going to get more powerful and more popular from here onwards.

There are hell lots of features in Power BI which make them different from other reporting platforms. Power BI is user-friendly tool which offers awesome drag and drop features and self-service capabilities which make it easy to use and learn.

There are three main components of Power BI platform:
1) Power BI Desktop (A desktop application)
2) Power BI Service (SaaS i.e. Software as a Service)
3) Power BI Mobile (For iOS and Android devices)

One of the plus features of Power Bi is that we can deploy Power BI on both on-premise and on-cloud platforms.

Why Power BI?

As we read what exactly Power BI is, now let’s understand why should we use Power BI?

Power BI is a huge platform where several kinds of services comes under it.
1) One of the important service under Power BI is Power BI Services which is a cloud based service which is used to view and share dashboard with end users or various stakeholders.
2) Power BI Desktop is the heart of Power BI platform which is a reporting interface where all the query editing and reporting part takes place.
3) Also one another useful service is Power BI Embedded that uses Azure cloud platform, and we can use for Data analysis and various ETL process.

Features of Power BI

So what are some of the key benefits that make this such a game changing product.

1)  Connect, transform and analyze millions of rows of data 

You can connect transform and analyze millions even hundreds of millions of rows of data and you can access that data from virtually anywhere whether it’s a database flat files on your desktop cloud services folders of files etc. There’s a huge huge connector library that allows you to access a ton of information and then not only that but you can create fully automated and repeatable ETL procedures to shape and transform and load the data from those different sources.

2) Build relational models to blend data from multiple sources.

We can actually build relational models inside of power BI. to blend the data from each of those multiple sources. And this is a concept that’s getting more and more important in the analytics world by creating relationships between all of those sources were able to analyze holistic performance across our entire data model. And that’s a critical skill set for anyone working in data or analytics or business intelligence it’s that ability to blend information tie sources together and paint that comprehensive view of performance.

3) Define complex calculations using Data Analysis Expressions (DAX)

We can define complex calculations using data analysis expressions or that DAX formula language. So we’ll be doing this to enhance our data sets and enables some really interesting advanced analytics techniques using those powerful and portable expressions.

4) Visualize data with interactive reports & dashboards

Most important one we can visualize or data with interactive reports and dashboards and what we’ll be doing throughout the course is actually building our own custom business intelligence tools using power be best in class visualization and dashboard features.

5) Power BI is the industry leader among BI platforms

And then last but not least, fact is power BI is the industry leader among other Business Intelligence platforms. It’s intuitive it’s powerful and most importantly it’s absolutely free to get started with power BI desktop.

Power BI vs MS Excel

Now last but not least just want to make a quick comparison between power BI and Excel because there is quite a bit of overlap here especially between Power BI and Excel.

So let’s think of this like Venn diagram where you’ve got power Excel tools on the left you’ve got power BI tools on the right. And this area of overlap in the middle with features that both platforms share. So here’s kind of what it looks like.

In summary you’ve got these Excel specific tools on the left like pivot tables, pivot charts, power map, power view and cube functions and then shifting over to the right side you’ve got the report, dashboard, views and power behind that don’t exist in Excel.

Got those custom visualization tools that we’ve been talking about as well as the publishing and collaboration options available through power vs service.

Coming to the intersection part. These two tools are actually built on the exact same engine. Power BI takes the same data shaping modeling and analytics capabilities and then adds these incredible new reporting and visualization and publishing tools on top of them.

So even though they’re called different things in different places you know that data loading tools
will be called either power query or get and transform and excel the data modeling tools will be called Power pivot.

The fact is it’s all the same thing. And the best news of all is that transitioning is incredibly easy. These two platforms play really really nicely together.

Power BI Components

Till now we all know why Power BI is so powerful and why it is used by so many organizations. So now let’s see what are various Power BI components which are used widely are.

1) Power Query: This component provided by Power BI is used to access, search and transform data from various data sources.
2) Power Pivot: It provides tools to model data from internal memory data source for analytics.
3) Power View: These components have various tools to represent data through various visuals which are used for visual analysis.
4) Power Map: It has abilities to represent spatial data in form of maps. The important advantage of Power BI is that we can use maps in different customized ways.
5) Power BI Desktop: Power BI Desktop is the heart of entire Power BI platform. Its development tool for Power View, Power Query, and Power Pivot. You can import various data sources and perform visualization tasks.
6) Power Q&A: Using the Power Q&A option, you can search for your data and find insights by entering queries in natural language format. It can understand your questions asked and answers it with relevant insights in form of various visualizations.
7) Power BI Service: The Power BI Service helps in sharing the workbooks and data views with other users. Even data refreshing can take place after regular intervals.
8) Power BI Mobile Apps: Business stakeholders can view and interact with the reports and dashboards published on a cloud service through mobile using Power BI Mobile Apps.

So lets start exploring Power BI with its architecture in more detail in the coming articles.🔥🔥🔥

Stay tunes!! Happy Learning!! 🙌🙌

Everything about print() in python

print() function:

Python print() function is used to print something on the screen. For printing we need to use print() function. Strings are the collection of character inside “double quotes” or ‘single quotes’.

If we observe then print is not a statement it is a function. It is an in-built python function.

sep: It is a key word that is used to seperate string and insert some values or some default space. Let’s see some examples

Rather than using \n or \t, we can also use symbols like comma (,) or plus (+) sign.

To display a variable’s value along with a predefined string, all you need to do is add a comma in between the two. Here the position of the predefined string and the variable does not matter.

Similar to a format argument where your print function acts as a template, you have a percentage (%) sign that you can use to print the values of the variables.

Like format argument, this also has a concept of placeholders. However, unlike the format function where you pass in just the index numbers, in this, you also need to specify the datatype the placeholder should expect.

%d is used as a placeholder for numeric or decimal values. %s is used as a placeholder for strings.

Formatting:

A good way to format objects into your string for print statement is with the string. Here two method are used.

1)Format Method

Syntax:

‘String here { } then also here { }’. format(‘something1’,’something2)

2)f-string (formatted string literals)


Also read:

CODE FOR PRACTICE:

print("Hello World")

print('Hello World')

#type() of print
type(print)

print('Python','tutorial','of','data crux')

print('Python','tutorial','of','data crux',sep='\n') #\n will put each word in a new line

print('Python','tutorial','of','data crux',sep=',')

print('Python','tutorial','of','data crux',sep='\n\n')

print('Python','tutorial','of','data crux',sep='+')

a = 3
b = "Datacux"
print(a,"is an integer while",b,"is a string.")

print("{0} is an integer while {1} is a string.".format(a,b))

print("%d is an integer while %s is a string."%(a,b))

print(f'{a} is an integer while {b} is a string')

TEST YOUR KNOWLEDGE !

0%

What is %s used for?

Correct! Wrong!

%s is always used to represent string. If you use integer with %s then it will perform typecasting.

How many are there in formatting?

Correct! Wrong!

There are two methods of formatting using format() method and formatting string.

Can we use other symbol in seperator sep() as well?

Correct! Wrong!

Yes!!!

print() function quiz