
Unlocking the Power of Tableau’s Data Model: Navigating Logical and Physical Layers
Tableau, a leading data visualization tool, relies on a robust data model to efficiently query connected database tables. Understanding the intricacies of Tableau’s data model is fundamental for harnessing its full potential. In this comprehensive guide, we will delve deep into Tableau’s data model, covering the logical and physical layers, their interactions, and practical examples.
The Heart of Tableau: The Data Model
Every data source you create in Tableau is underpinned by a data model—a critical framework that instructs Tableau on how to interact with your database tables. Let’s explore this concept thoroughly.
The foundation of the data model is built upon the tables you add to the canvas in the Data Source page. This structure can range from a simple, single table to a complex network of interconnected tables via relationships, joins, and unions.
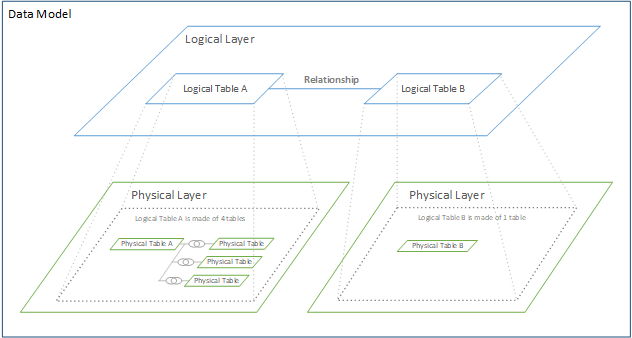
Tableau Desktop’s Data Model comprises two distinct layers:
- The Logical Layer
- The Physical Layer
Both layers can work in harmony, but a clear understanding of your source data is essential before deciding which layer to employ.
However the logical layer is generally more forgiving than the physical layer. When you first connect to any data within Tableau, you start with Logical Layer.
If you want to add additional data, you will have to decide between the logical and physical layer.
Logical Layer: A Dynamic Web of Relationships
The initial view you encounter on the data source page canvas is the logical layer of your data source. This logical layer leverages Tableau’s data model to establish connections, often referred to as “noodles,” between two or more data tables. These connections are dynamic and adaptable, only retrieving data when specific fields from these tables are actively utilized.
Furthermore, these relationships have the versatility to accommodate data at varying levels of detail, including the ability to handle many-to-many relationships. Think of this layer as the canvas where relationships come to life, much like an artist’s canvas on the Data Source page.

Example: Consider a scenario where you have a sales table and a customer table. In the logical layer, you can create a dynamic relationship between them using a shared “customer ID” field.
Logical layer represents the canvas for creating relationships between tables.
Physical Layer: Building Structure with Joins and Unions
Within the physical layer, you have the capability to establish joins and/or unions with your data. However, it’s important to note that the physical layer differs from the dynamic and flexible nature of the logical layer. It is most effectively employed when dealing with data that exists at a uniform level of detail, making it suitable for creating one-to-one joins.
In this layer, each logical table must incorporate at least one physical table. To view or implement joins and unions within the physical layer, simply double-click on a logical table.

It’s crucial to exercise caution when utilizing the physical layer for data with varying levels of detail, as this may lead to unintended data duplication.
Example: Imagine you have multiple data tables representing different product categories. The physical layer enables you to join them, creating a unified product catalog.
Physical layer represents the canvas for creating unions & joins between tables.
Remember: The Physical layer joins tables together, while the Logical layer keeps tables separate, but defines relationships between them.
Note: Prior to Tableau 2020.2, Tableau had only the physical layer.
The Dance of the Layers: How They Interact
Since Tableau version 2020.2, the logical layer takes precedence when opening a data source. Adding tables from the left (physical tables) automatically places them in the physical layer, generating corresponding logical tables.
To switch to the physical layer and perform joins, simply double-click on a logical table. It’s worth noting that physical tables joined in this manner will display a small Venn diagram in the resulting logical table.
In your visualization view, the number of logical tables impacts what you see. If you have only one logical table (possibly comprised of joined physical tables), you will see those physical tables in your view. However, when multiple logical tables are present, indicative of relationships, all logical tables will be visible in your view.
Difference between Logical Layer and Physical Layer
Now that we’ve explored both layers in depth, let’s summarize their key characteristics in a tabular format for quick reference:
| Logical Layer | Physical Layer |
| 1) Relationships canvas in the data source page. | 1) Joins/Union canvas in the data source page. |
| 2) Highly dynamic and flexible | 2) Less flexible, best for same-level data |
| 3) Supports complex relationships, including many-to-many | 3) Typically one-to-one joins |
| 4) Tables that you drag here are called logical tables. | 4) Tables that you drag here are called physical tables. |
| 5) Logical tables can be related to other logical tables. | 5) Physical tables can be joined or unioned to other physical tables. |
| 6) Logical tables are like containers for physical tables. Accessed directly from the canvas | 6) Double click a logical table to see its physical tables. |
| 7) Level of details is at the row level of the logical table. | 7) Level of details is at the row level of merged physical tables. |
| 8) Logical tables remain distinct (normalized), not merged in the data source. | 8) Physical tables are merged into a single, flat table that defines the logical table. |
| 9) Adaptable to different data detail levels | 9) Suited for data at the same level of detail |
| 10) Potential for complex relationships | 10) Risk of data duplication with varying details |
This tabular overview highlights the distinct characteristics of each layer, aiding in your understanding and selection of the most suitable layer for your specific data modeling needs in Tableau.
To become a Tableau maestro, you must navigate the intricacies of Tableau’s data model, with its logical and physical layers. The logical layer excels at dynamic relationships, while the physical layer brings structure to your data. Understanding their interactions is the key to unleashing the full potential of Tableau for data analysis and visualization. So, roll up your sleeves, explore these layers, and let your data-driven insights shine brilliantly in Tableau!
I hope you liked the article. Stay Tuned…!!!
Happy Tableauing…!!!